Thought of the Week - Which economic surprises matter?
There are so many economic indicators around these days that it can be overwhelming for non-specialists to know which ones matter. So here is a brief cheat sheet based on my experience and some work by Maria Viera at LSEG.

First, always remember that markets move in reaction to surprises in economic data, not the data itself. If the consensus expectation for inflation is 3% and the data shows 3% inflation, you wouldn’t expect any major move in markets. If the consensus expectation is for inflation to come in at 2.5% and the data shows 3%, you’d expect markets to move strongly.
Caveat 1: Consensus expectations are not always the number given in the press or on a market data terminal. Remember that the consensus expectations shown on a terminal or quoted in the press are coming from surveys of professional economists. But economists aren’t the dominant force in financial markets, investors are. If investors have a materially different expectation than surveys among economists show, then a 3% inflation print when 3% was ‘expected’ can still move the market.
Caveat 2: Remember that different data providers survey different groups of economists, so what is consensus in Bloomberg may be different from what is consensus in Reuters, etc.
Caveat 3: Surveys are not held every day and the ‘consensus’ number may include estimates that are stale and several weeks old. Different data providers have different ways of dealing with stale forecasts, which brings us back to caveat 2.
Second, the size of the surprise matters. Data like industrial production or retail sales is relatively volatile, while inflation tends to be smoother. Hence, a 0.5% deviation from consensus in retail sales will likely have a much smaller impact than a 0.5% deviation in inflation. A good way to deal with this problem is to express surprises in z-scores or the number of standard deviations above or below the consensus a data release ended up.
Caveat: Market reactions to surprises are not linear. A surprise data release that deviates by twice as much as a previous data release will likely create a market response that is more than twice as large. The larger the surprise, the more extreme the market’s reaction, because more and more investors have to reassess their market outlook and more investors will succumb to blind panic or euphoria.
Third, the market reaction to economic surprises can change dramatically over time. It all depends on the prevailing market narrative and the general market environment. I have shown in a previous post how, in the zero-interest-rate world after 2010, markets often reacted very differently to economic surprises than before 2008. Today, we are no longer in a zero-interest-rate world and one thing we have to figure out in 2024 is whether we have reverted to pre-2008 market reactions or are still in a post-2010 market reaction world – and we have to understand why we are in one world or the other.
I honestly don’t know which one of those two regimes we are in right now or if we have entered an altogether new regime. What I do feel strongly about is that one indicator that worked well in the last 15 years has lost its power. After 2010, many investors relied on the size of the Fed balance sheet to assess if US stock markets rallied or not. If the Fed expanded its balance sheet through QE, markets would rally. If the Fed contracted its balance sheet, markets would move sideways or down. That is no longer the case because monetary policy is not conducted via QE anymore. Instead, we have gone back to good old-fashioned interest rate hikes and cuts. The result is that the size and change in the Fed’s balance sheet have zero predictive power for the direction of the market anymore – something that many pundits got wrong in 2023 and still haven’t understood. The only thing that matters for markets today is interest rate hikes and cuts and where markets expect rates to go in the next 12 months.
Fourth, I tend to think that the three most important drivers of both equity and bond markets are economic growth, inflation, and interest rates. Everything else is secondary. And if you are an equity investor, you would be surprised, how little economic growth, expressed as earnings growth, matters. Read this post and you will learn that changes in interest rates and inflation are often far more important than changes in earnings growth for share prices.
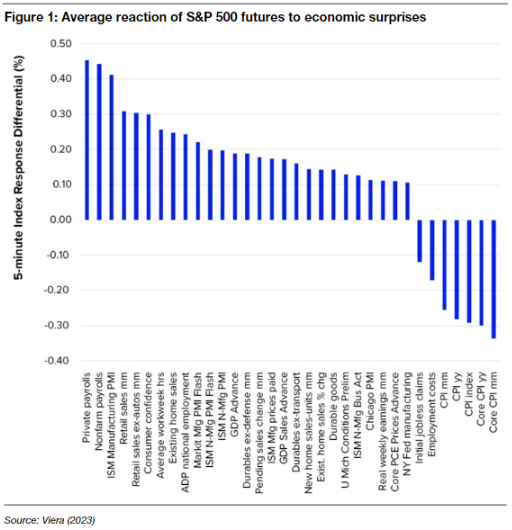
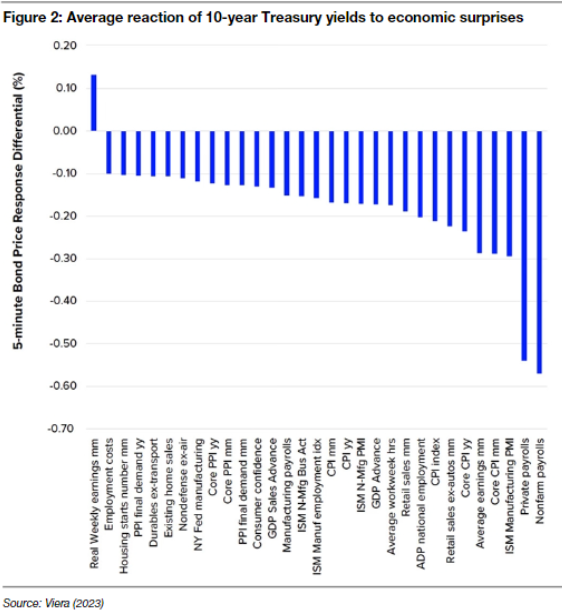
This brings me to the work by Maria Viera who looked at the difference in market movements to economic surprises. She looked at the market movements in the 5-minute interval after a data release and measured the average difference in performance between the 20% largest and 20% smallest surprises.

Here is the impact of different economic surprises on the S&P 500 futures between 2009 and 2022 (thus, beware that this measures mostly the period of zero interest rates).
The largest reactions of the S&P 500 can be seen for unemployment data, inflation data (in particular core inflation), manufacturing PMI, retail sales, and consumer confidence. This makes a lot of sense since the unemployment data is both a reflection of the strength of economic growth and a driver of future monetary policy, while both the manufacturing PMI and consumer confidence are forward-looking indicators of future GDP growth.
GDP growth data itself isn’t all that meaningful, as we all (should) know, since it is released only every three months and typically long after the end of a quarter, so proxies for the real economy, like retail sales or PMI indicators, are much more important to follow. In general, as a rule of thumb, I would say that if you are a regular investor and not a macro specialist or a strategist, all you need to look at is inflation, unemployment, PMIs, and consumer confidence. Everything else is a bonus.

But what about interest rates? Here is the reaction of the 10-year Treasury yield to macroeconomic surprises. The set of relevant indicators is even smaller than for equities. In essence, all that matters are surprises to core inflation, unemployment, and manufacturing PMIs. The rest is not that relevant and possibly mere noise.
Of course, the final step is to assess how the 10-year Treasury yield influences equity markets. This is where things become interesting and where the difference between first-level thinking and second-level thinking is.
First-level thinking only looks at the direct impact of economic surprises on stocks and bonds. It allows you to understand the market. Second-level thinking analyses how the change in bond markets influences equity markets and how the combination of economic surprise and changing bond yields may change the equity market, the expectations of investors (i.e. consensus), and the narrative around equity markets going forward. This is what allows you to beat the market. Unfortunately, as Howard Marks so eloquently stated, too many investors are stuck in first-level thinking, and not very many practice second-level thinking.
So, if you think this supposed ‘cheat sheet’ is too complicated and convoluted and has too many caveats, let me tell you that you better get used to it. There is no easy way to beat the market, no simple checklist to follow, because if there were, everybody would do it and the checklist would simply become market consensus again, and following it at best will give you average returns. To quote Charlie Munger from the Howard Marks letter linked above: “It’s not supposed to be easy. Anyone who finds it easy is stupid.”
Thought of the Day features investment-related and economics-related musings that don’t necessarily have anything to do with current markets. They are designed to take a step back and think about the world a little bit differently. Feel free to share these thoughts with your colleagues whenever you find them interesting. If you have colleagues who would like to receive this publication please ask them to send an email to joachim.klement@liberum.com. This publication is free for everyone.


